E-Commerce Intelligence
Ecommerce is not a marketing problem. It is a mathematics problem dressed in a marketing interface.
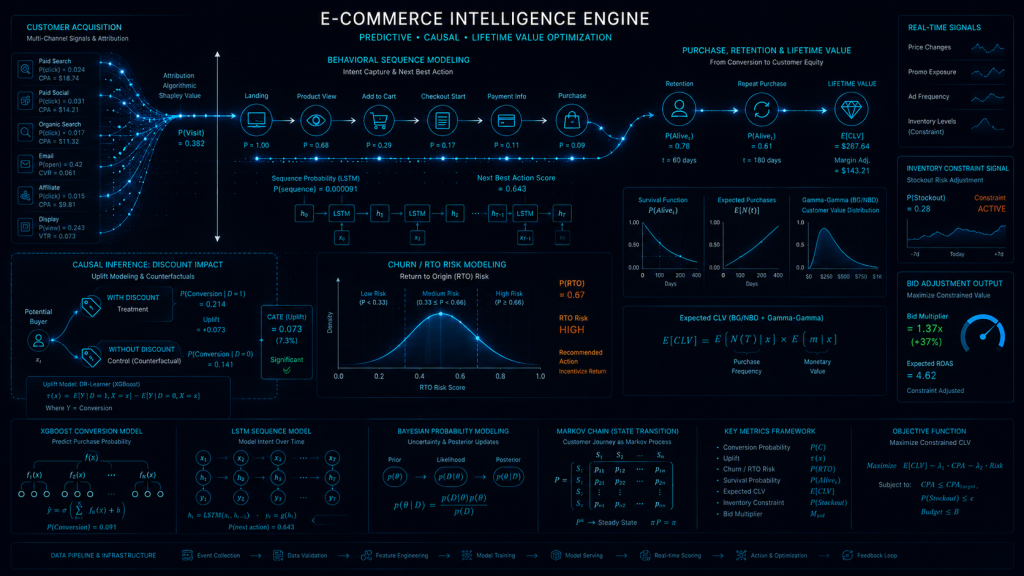
Every ecommerce platform gives you a dashboard. Revenue. Orders. Conversion rate. Average order value. Return rate. These numbers create an illusion of visibility — the feeling that because you can see the metrics, you understand the business.
You do not understand the business until you understand the mathematics underneath the metrics.
The discount you gave last week — how much of it was genuinely necessary to convert the customer, and how much of it was margin destruction on a customer who would have purchased at full price regardless? The cart abandonment sequence you automated — how much of it is recovering genuinely lost sales, and how much of it is training customers to abandon carts on purpose to wait for the discount? The retention campaign you launched — how many of the customers it targeted were genuinely at risk of churning, and how many were going to repurchase anyway without any intervention?
Standard ecommerce analytics cannot answer these questions. They can tell you what happened. They cannot tell you what would have happened differently — which is the only question that actually matters for making better decisions.
E-Commerce Intelligence applies causal machine learning, deep learning sequence modeling, reinforcement learning, and probabilistic behavioral modeling to answer the questions that standard ecommerce dashboards are architecturally incapable of answering.
The Problem With Standard Ecommerce Marketing
The standard ecommerce marketing playbook has not changed significantly in a decade:
Acquire customers through paid channels. Recover abandoned carts with automated discount sequences. Retain customers through email flows. Win back lapsed customers with blanket re-engagement campaigns. Optimize conversion rate through A/B testing. Report revenue and ROAS.
Every component of this playbook has a mathematical problem that standard practice either ignores or cannot detect:
Discount automation destroys margins systematically. Blanket cart abandonment sequences give discounts to every abandoner — including the majority who would have purchased at full price with a non-discount nudge, and those who will never purchase regardless of the incentive offered.
Retention campaigns target the wrong customers. Standard retention models identify lapsed customers by recency — time since last purchase. They do not identify which lapsed customers have a genuine mathematical probability of reactivation versus which have permanently churned. The result: retention budget is distributed uniformly across both groups — wasting resources on customers who are not coming back regardless of the offer.
Inventory and advertising are disconnected. Ad spend continues to flow toward products approaching stock-out — generating demand that cannot be fulfilled, damaging customer experience, and wasting media budget that could have been redirected toward high-margin, high-inventory products.
Return economics are not modeled at the order level. In markets with high cash-on-delivery adoption — Pakistan, South Asia, Middle East, parts of Southeast Asia — return rates on COD orders can reach 30 to 50% for certain product categories. Standard practice treats returns as an aggregate metric to minimize. Mathematical practice predicts return probability at the individual order level — enabling proactive intervention before dispatch.
Flash sales create data integrity problems. High-traffic promotional events generate cart manipulation, inventory signal distortion, and behavioral anomalies that corrupt the machine learning models downstream — if the data is not cleaned in real time during the event.
E-Commerce Intelligence addresses every one of these problems with specific, mathematically validated solutions — built on the actual transactional and behavioral data that ecommerce platforms generate but standard analytics tools fail to exploit.
The Six E-Commerce Intelligence Solutions
Solution 01 — Margin-Optimized Discount Uplift Modeling
Powered by Causal ML Two-Model Approach + Meta-Learners (S/T/X-Learner) + Uplift Trees
The problem this solves:
Discount automation is the most margin-destructive practice in ecommerce — not because discounts are inherently wrong, but because they are applied without mathematical understanding of which customers actually need them to convert.
Every customer who receives a discount falls into one of four categories:
Persuadables — customers who convert because of the discount but would not have converted without it. This is the only group where the discount generates genuine incremental revenue.
Sure Things — customers who would have purchased at full price regardless. Every discount given to this group is pure margin destruction with zero incremental revenue benefit.
Lost Causes — customers who will not convert regardless of the discount offered. Every discount given to this group is waste with zero return.
Sleeping Dogs — customers who would have converted without a discount but will not convert if a discount is offered — because the discount creates distrust or signals lower quality. Giving discounts to this group actively harms conversion.
Standard automated discount sequences do not distinguish between these four groups. They treat every cart abandoner identically — distributing margin destruction uniformly across all four behavioral types.
What this solution does:
Causal ML uplift modeling — specifically the Two-Model Approach combined with X-Learner meta-learning — is trained on historical purchase and intervention data to estimate the Individual Treatment Effect (ITE) of discount offers for each customer segment. The model identifies, for each customer, the estimated probability of conversion with a discount minus the estimated probability of conversion without a discount — the true uplift score.
Discount interventions are targeted only toward customers with positive uplift scores above a defined threshold — eliminating discount spend on Sure Things, Lost Causes, and Sleeping Dogs while maximizing conversion uplift among genuine Persuadables.
The measurable outcome:
Reduction in total discount spend with maintenance or improvement of total conversion volume — because the same number of Persuadables convert at lower overall discount cost, while Sure Things and Lost Causes are no longer subsidized.
Who needs this:
Any ecommerce business running cart abandonment automation, promotional email sequences, or flash sale discount mechanics where total discount spend is a meaningful percentage of revenue and where margin protection is a strategic priority.
Solution 02 — Cold-Start Customer Churn Detection
Powered by Deep Learning Sequence Modeling / LSTM + Early Warning Signal Extraction
The problem this solves:
Traditional churn prediction models require sufficient behavioral history to generate reliable predictions — typically 90 to 180 days of customer activity. New customers, by definition, do not have this history. Yet new customers churn at the highest rates — often within the first 30 to 90 days — and the behavioral signals that predict early churn are present in the data long before standard models can detect them.
The window where early churn intervention is most effective — and least expensive — is exactly the window where standard churn models have the least predictive power.
What this solution does:
LSTM (Long Short-Term Memory) deep learning models are trained on sequential behavioral data from the customer’s first interactions — page views, product engagement patterns, email open sequences, session depth, time-between-visits — rather than aggregate behavioral summaries. These models learn the sequential patterns that differentiate high-retention new customers from early-churn new customers, based on the order and timing of early behavioral signals.
Churn risk scores are generated for new customers within their first 7 to 14 days — with sufficient lead time to implement targeted retention interventions before the behavioral disengagement pattern becomes irreversible.
Who needs this:
Subscription ecommerce brands, DTC businesses, and membership-based retail businesses where first-90-day retention is the primary driver of long-term unit economics and where standard churn models lack sufficient data to generate reliable predictions for new customer cohorts.
Solution 03 — Inventory-Constrained Ad Spend Reinforcement Learning
Powered by Dynamic Bidding Loops Constrained by Days of Supply + Reinforcement Learning Policy Optimization
The problem this solves:
Paid media campaigns run on fixed budget allocations that are set weekly or monthly — independent of real-time inventory status. The result: ad spend continues flowing toward products approaching stock-out, generating purchase intent that cannot be fulfilled, creating negative customer experiences, and wasting media budget that could have been redirected toward high-margin, high-inventory alternatives.
The inverse problem also occurs: high-inventory, high-margin products that could absorb significantly more media investment receive insufficient budget because their historical conversion volume does not signal the need for budget increase through standard optimization logic.
What this solution does:
A Reinforcement Learning bidding policy is trained to continuously optimize bid adjustments and budget allocation across product categories based on three simultaneous inputs: real-time inventory data (Days of Supply for each product), historical conversion data by product, and current margin data by SKU.
The policy learns, through continuous reward signal optimization, to automatically reduce bids and reallocate budget away from low-inventory products before stock-out occurs — and to increase bids toward high-margin, high-inventory products that have absorption capacity for additional media investment.
The system connects directly to the ecommerce platform’s inventory API and the ad platform’s bidding API — operating as a continuous, automated optimization loop rather than a periodic manual adjustment process.
Who needs this:
Ecommerce brands with significant SKU diversity — particularly fashion, apparel, electronics, and seasonal product categories — where inventory levels fluctuate rapidly and where the operational cost of manual bid management aligned with inventory status is prohibitive.
Solution 04 — Probabilistic Order Return (RTO) Propensity Classification
Powered by XGBoost on Clickstream + Checkout Behavioral Signals + Geographic Pattern Analysis
The problem this solves:
In markets where cash-on-delivery (COD) is the dominant payment method — Pakistan, India, much of the Middle East, and significant portions of Southeast Asia — return-to-origin (RTO) rates on COD orders are the single largest driver of logistics cost and unit economic deterioration. A business achieving 30% gross margins on paper can find its actual margins at 5 to 10% after accounting for the full logistics cost of returned COD orders — outbound shipping, return shipping, restocking, and lost product opportunity.
Standard practice treats COD RTO as an aggregate metric to minimize through blanket interventions — requiring phone verification for all COD orders, restricting COD availability for certain products, or adding COD surcharges across the board. These interventions add friction for genuine customers to prevent returns from high-risk customers — a mathematically suboptimal tradeoff.
What this solution does:
An XGBoost classification model is trained on historical order data combined with behavioral signals extracted from the checkout process — device type, session duration, browsing depth, time of order, geographic location at postal code level, product category, order value, payment method selection behavior, and historical order pattern for returning customers.
The model generates, for every new order at the point of placement, a probabilistic RTO risk score. Orders above defined risk thresholds trigger targeted interventions — phone verification requests, prepayment incentive offers, or COD restriction for specific risk profiles — while low-risk orders proceed without friction.
The measurable outcome:
Reduction in RTO rate concentrated among high-risk order segments — with minimal friction added to the legitimate customer experience for low-risk orders.
Who needs this:
Pakistani ecommerce businesses, South Asian DTC brands, and Middle Eastern ecommerce operations where COD is the dominant payment method and where RTO rates are a primary driver of logistics cost and margin erosion.
Solution 05 — Non-Contractual Customer Latent Dropout Estimation
Powered by BG/NBD P(Alive) Probability Distribution + Pareto/NBD Extensions
The problem this solves:
In non-subscription ecommerce, customers can stop buying without cancelling anything, without notifying the business, and without any visible signal that distinguishes them from customers who are simply in a longer-than-usual inter-purchase interval. A customer who last purchased 90 days ago might be permanently churned — or might be three days away from their next purchase.
Standard recency-based segmentation cannot distinguish between these two possibilities. The result: win-back campaigns are sent to customers who were about to repurchase anyway (wasting incentive cost), while genuinely churned customers who require different intervention timing receive the same message as near-purchasers.
What this solution does:
The BG/NBD (Beta-Geometric/Negative Binomial Distribution) probabilistic model is fitted to each customer’s historical purchase sequence — estimating, for each customer, the mathematical probability that they are still “alive” (i.e., have not permanently churned) and their expected future purchase rate conditional on being alive.
The P(Alive) score for each customer is calculated and updated after every observed purchase or non-purchase interval — producing a continuous probability estimate that distinguishes genuinely lapsed customers from those in normal inter-purchase variation.
Win-back campaigns are targeted using P(Alive) thresholds rather than recency thresholds — concentrating intervention cost on customers with meaningful reactivation probability while eliminating spend on customers whose P(Alive) score indicates permanent dropout.
Who needs this:
Non-subscription ecommerce businesses where customer repurchase cycles vary significantly across customer segments — fashion, health and wellness, home goods, specialty food — and where win-back campaign ROI has historically been low due to indiscriminate audience targeting.
Solution 06 — Flash Sale Cart Manipulation & Anomaly Detection
Powered by Sequential Isolation Forests + Real-Time Behavioral Velocity Analysis
The problem this solves:
Flash sales, limited-release product drops, and high-traffic promotional events create conditions that attract systematic manipulation — at a scale and sophistication that standard inventory management and fraud detection systems are not designed to handle.
Cart hoarding bots add high-demand products to carts without purchase intent — creating false scarcity signals, triggering artificial demand indicators, and potentially enabling secondary market arbitrage. Competitor bots probe inventory availability signals to gain tactical pricing information. Promotion gaming bots exploit discount mechanics, referral systems, and promotional code structures. And the behavioral anomalies generated by legitimate high-volume traffic during flash events can corrupt the machine learning models that downstream marketing systems rely on — if anomalous data is ingested into training sets without cleaning.
What this solution does:
A Sequential Isolation Forest pipeline is deployed specifically for high-traffic event windows — monitoring cart addition velocity, checkout progression rates, session behavioral patterns, and inventory request frequencies across the full traffic volume in real time.
Statistical anomalies inconsistent with genuine human purchase behavior are flagged in real time — distinguishing bot-driven cart hoarding from legitimate customer interest spikes, identifying systematic promotion gaming patterns, and generating data quality flags that prevent anomalous event-window data from contaminating downstream ML model training sets.
High-confidence bot identifications are automatically blocked from cart interactions via API integration — protecting genuine customer access to limited inventory and maintaining data integrity throughout the promotional event.
Who needs this:
Ecommerce brands running limited-release product drops, high-demand flash sales, or competitive promotional events — particularly in fashion, footwear, consumer electronics, and collectibles categories where secondary market arbitrage creates strong economic motivation for systematic cart manipulation.
The Complete E-Commerce Intelligence Infrastructure
Beyond the six core solutions above, E-Commerce Intelligence integrates with the full suite of Predictive Intelligence solutions — creating a comprehensive mathematical infrastructure for ecommerce business decision-making:
LTV Prediction — BG/NBD + Gamma-Gamma CLV modeling applied to acquisition bidding and retention investment prioritization
Churn Prediction — LSTM-based behavioral sequence modeling for subscription and repeat-purchase ecommerce
Customer Segmentation — Behavioral clustering for personalization, email targeting, and product recommendation
Recommendation Systems — Neural Collaborative Filtering for product recommendation at individual customer level
Sales Forecasting — Temporal Fusion Transformer ensemble for demand planning and inventory optimization
Marketing Mix Modeling — Bayesian MMM for privacy-safe cross-channel budget allocation
Together, these solutions form a complete mathematical operating system for ecommerce decision-making — replacing the intuition-based, dashboard-dependent, activity-focused approach that most ecommerce businesses currently operate on.
Industry Vertical Specifics
Fashion & Apparel
Seasonal demand modeling, size and color preference clustering, markdown timing optimization, trend-driven inventory reallocation, and visual similarity-based recommendation.
Health & Wellness / Supplements
Subscription conversion prediction, reorder timing modeling, ingredient preference segmentation, and compliance-aware content marketing attribution.
Beauty & Cosmetics
Shade range performance prediction, repurchase cycle modeling, influencer attribution incrementality, and cross-sell recommendation across complementary product categories.
Consumer Electronics
High-consideration purchase cycle modeling, feature preference segmentation, warranty and accessory cross-sell optimization, and return rate prediction by product configuration.
Home & Living
Seasonal demand forecasting, basket size optimization, style preference clustering, and inventory-constrained paid media optimization for large-SKU catalogs.
Food & Beverage / FMCG
Subscription meal kit churn prediction, flavor preference segmentation, promotional uplift modeling, and geographic demand forecasting for distribution optimization.
The Honest Answers to Real Client Questions
“We already have a good ecommerce platform with built-in analytics. Why is this different?”
Ecommerce platform analytics — Shopify Analytics, WooCommerce reports, Magento dashboards — are descriptive systems. They tell you what happened. E-Commerce Intelligence is a predictive and prescriptive system. It tells you what is about to happen, why it will happen, and what the mathematically optimal intervention is. These are categorically different levels of analytical capability. A descriptive system cannot answer “which customers should receive a discount versus full price” because that question requires counterfactual reasoning — modeling what would have happened in a scenario that did not occur. Only causal ML can answer counterfactual questions.
“Our return rate is already acceptable. Is RTO modeling still relevant?”
In COD-dominant markets, “acceptable” return rates are frequently defined relative to industry averages rather than relative to what is mathematically achievable. A 25% COD RTO rate may be industry average — but if targeted RTO propensity modeling can reduce high-risk order returns by 40% while adding friction for only 8% of total orders, the economic impact is substantial regardless of whether the starting rate was “acceptable.” The question is not whether the current rate is acceptable. The question is whether the mathematically achievable rate with targeted intervention generates sufficient economic value to justify the modeling investment.
“We tried win-back campaigns and they did not perform. Why would P(Alive) modeling be different?”
Underperforming win-back campaigns almost universally share a common cause: the audience selection was based on recency segmentation rather than probabilistic churn estimation. Recency-based win-back campaigns include a significant proportion of customers who were going to repurchase anyway — diluting measured campaign lift — and exclude a significant proportion of genuinely lapsed customers who fell outside the recency window but have positive reactivation probability. P(Alive) modeling targets the mathematically right audience — producing higher measured lift from the same campaign spend.
“Can you guarantee reduced return rates or improved margins?”
No specific metric guarantee is made. What is guaranteed: mathematically precise identification of the customer segments, order patterns, and behavioral signals most predictive of each inefficiency category — with statistical evidence of the magnitude of each category before any intervention model is deployed.
Who E-Commerce Intelligence Is Built For
Mid-to-large ecommerce brands generating $500K+ annual revenue where margin optimization, retention economics, and LTV-based decision-making directly impact profitability — not just top-line revenue.
DTC brands in competitive categories where customer acquisition costs are rising and where long-term profitability depends on improving retention rates and average customer lifetime value rather than continuously increasing acquisition volume.
COD-dominant market operators in Pakistan, South Asia, and the Middle East where RTO rates are a primary driver of logistics cost and unit economic deterioration.
High-SKU ecommerce retailers in fashion, electronics, and home goods where inventory management, seasonal demand forecasting, and inventory-constrained advertising create significant optimization opportunity.
Subscription ecommerce businesses where churn prediction, CLV modeling, and early intervention in the customer lifecycle are the primary levers for unit economic improvement.
The diagnosis starts with your transaction data — not your dashboard.
→ Start With the Audit (link to /work-with-me)
→ Understand the Framework (link to /approach/my-framework)
→ View All Solutions (link to /solutions)