
Ecommerce & DTC Analytics SaaS vs Cognitive Intelligence
Triple Whale, Northbeam, Lifetimely, Glew and Polar Analytics solved a genuine operational problem: ecommerce data fragmented across Shopify, ad platforms, email tools and analytics into disconnected silos. Consolidating that into one dashboard takes real engineering.
This consolidation is genuinely valuable. It is not intelligence. These platforms tell you what happened. They do not predict what is about to happen, identify the causal mechanism behind it, or build the infrastructure to optimise the decisions that actually determine ecommerce margin.
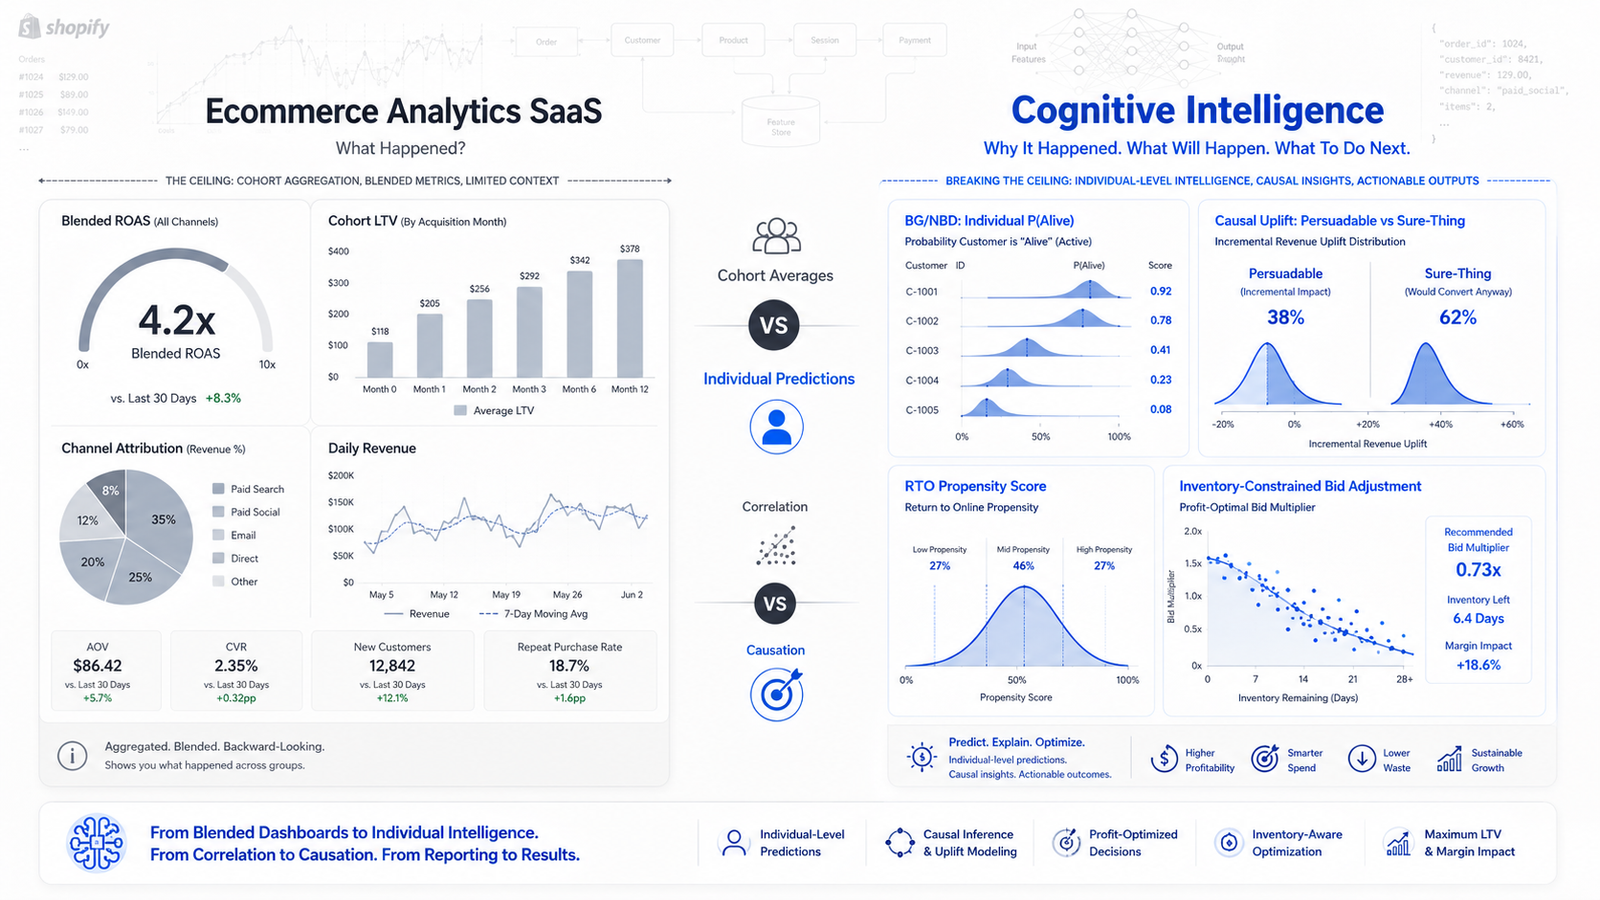
What are ecommerce and DTC analytics SaaS tools?
Data consolidation and visualisation platforms built specifically for DTC and ecommerce — aggregating Shopify, ad platforms, email tools and analytics into unified performance dashboards. Their primary value is operational visibility: a consolidated view that would otherwise take significant data engineering to assemble.
Most include multi-touch attribution using pixel-based or probabilistic matching. Some include cohort analysis and LTV calculation. A few include contribution margin analysis that incorporates COGS and shipping into ROAS.
What they are: data consolidation and visualisation with attribution features. What they are not: predictive intelligence systems, causal inference platforms, or optimisation engines for the decisions that determine ecommerce profitability.
Four tiers of ecommerce analytics
Most comparisons cover tier 1 only. Ecommerce operators are usually running two or three of these tiers at once — and paying for overlapping capability without realising it.
Unified DTC dashboards
- Triple Whale
- Northbeam
- Polar Analytics
- Glew
- Peel Insights
- Daasity
Consolidate Shopify, ad platforms and email into one performance view with attribution layered on top. The default choice for DTC brands past roughly $50k monthly ad spend.
LTV and profitability specialists
- Lifetimely
- Decile
- Admetrics
- Retention.com
- Saras Analytics
- LTV.ai
Narrower by design — cohort LTV, contribution margin, payback period. Decile is the closest thing in this tier to genuine predictive LTV, and even it works from cohort-derived scores rather than individual probabilistic modelling.
Native and platform analytics
- Shopify Analytics
- Shopify Segments
- Klaviyo Predictive Analytics
- GA4 Ecommerce
- Amazon Brand Analytics
Check this tier before buying anything. Klaviyo already produces predicted CLV and churn risk; Shopify Segments already does behavioural grouping. For brands under roughly $50k monthly spend this is frequently enough, at no extra cost.
Pipelines and warehouse-first
- Fivetran
- Airbyte (open source)
- Supermetrics
- Funnel.io
- dbt
- Google BigQuery
Not dashboards — infrastructure. They move raw Shopify and platform data into a warehouse you control. This is the tier that makes custom modelling possible, and the one most DTC brands skip.
Honest analysis of the leading platforms
Each assessment covers genuine strengths and where the architecture stops.
Triple Whale
What it doesThe most widely adopted DTC analytics platform — unified Shopify revenue, ad spend, blended ROAS, its own pixel-based attribution, cohort analysis and contribution margin, with the Moby AI layer for natural language querying.
Who uses itDTC brands on Shopify spending $50,000 to $10M+ monthly on paid media.
Genuine strengthsShopify integration quality is among the best in the category. Clean dashboard for teams without data engineering. Contribution margin incorporating COGS, shipping and fees is more operationally meaningful than raw ROAS. Active product development.
Where the ceiling isAttribution applies fixed rules that are not causally validated. LTV uses historical cohort averages, not individual prediction. Moby generates natural-language summaries of dashboard data rather than causal analysis. And its pixel is subject to the same iOS degradation and cross-device fragmentation it was built to solve.
Northbeam
What it doesML-enhanced attribution combining pixel tracking, server-side collection and machine learning to model the full customer journey, with MMM capability layered on.
Who uses itMid-market to enterprise DTC brands spending $200,000 to $10M+ monthly where attribution accuracy is the primary concern.
Genuine strengthsML-weighted touchpoint attribution produces more defensible output than last-click or linear models. Server-side collection reduces browser signal loss. Clean interface. MMM integration for strategic budget modelling.
Where the ceiling isThe ML model learns correlations between touchpoints and conversions, not causal relationships — it cannot distinguish a touchpoint that caused a conversion from one that was merely present. LTV remains cohort-based. At enterprise pricing, that is significant investment in attribution that stays correlational.
Lifetimely
What it doesLTV and profitability analysis for Shopify and WooCommerce — cohort LTV, contribution margin, CAC by channel and payback period modelling.
Who uses itDTC and subscription brands where LTV economics are the primary metric — subscription boxes, consumables, repeat-purchase brands.
Genuine strengthsGenuine focus on profitability rather than gross ROAS. Cohort LTV visualisation tracking how acquisition cohorts develop. Payback period modelling for evaluating acquisition sustainability. Clean interface for finance and marketing collaboration.
Where the ceiling isLTV calculations are retrospective cohort averages. Knowing a January cohort reached $185 at twelve months tells you nothing about which customers inside it drove that average — so you cannot identify which channels, creatives or segments produce the high-value end of the distribution.
Glew
What it doesMulti-channel ecommerce reporting across sales channels, marketing platforms, inventory and customer segments, with integrations spanning Shopify, WooCommerce, Magento, Amazon and eBay.
Who uses itMid-market ecommerce operating across multiple sales channels — Shopify plus Amazon plus wholesale.
Genuine strengthsBroader integration coverage than most competitors. Customer segmentation by purchase behaviour for operational audience definitions. Inventory and supply chain data connected to marketing performance.
Where the ceiling isFundamentally a reporting consolidation platform — analytical depth does not extend beyond descriptive statistics and historical segmentation. Segments are rule-based RFM thresholds rather than behavioural clustering that finds naturally occurring groups in the data.
Polar Analytics
What it doesData consolidation and BI for ecommerce — building a unified warehouse from Shopify, ad platforms and email tools with custom metric definitions through a no-code interface.
Who uses itMid-market brands and agencies needing more analytical flexibility than rigid dashboard templates allow.
Genuine strengthsFlexible data modelling with custom metrics beyond standard templates. Strong warehouse architecture giving cleaner underlying data. Agency-friendly multi-brand management.
Where the ceiling isThe flexibility is a platform capability, not an analytical one. It enables custom reporting on historical data without adding prediction, causal inference or optimisation. Most valuable as a foundation for analytical infrastructure — the intelligence still has to come from outside.
Decile
What it doesCustomer data and predictive LTV for DTC, combining first-party purchase behaviour with third-party consumer enrichment to score and segment customers.
Who uses itDTC brands wanting audience intelligence and predicted value in the same platform.
Genuine strengthsClosest in the specialist tier to genuine predictive LTV. Third-party enrichment genuinely helps thin first-party datasets. Segment activation pushes directly into ad platforms.
Where the ceiling isScores are derived from cohort patterns plus enrichment rather than individual probabilistic modelling, and enrichment creates dependency on data whose provenance you do not control and which privacy regulation is progressively restricting.
Also assessed: Peel Insights, Daasity, Admetrics, Saras Analytics, Retention.com, LTV.ai, Shopify Analytics, Klaviyo Predictive Analytics and the pipeline tier — Fivetran, Airbyte, Supermetrics, Funnel.io. The differences are integration breadth, pricing and interface. The five limitations below apply to every one of them.
Why cohort LTV hides the number you actually need
Placeholder — no video yet. Delete this box and drop in the Elementor Video widget when the recording is ready, or hide this whole section from Advanced → Responsive until then.
Descriptive analytics without prediction
Every ecommerce analytics platform is fundamentally descriptive. Revenue by channel. Orders by day. LTV by cohort. ROAS by campaign. Valuable for monitoring — insufficient for the decisions that determine profitability.
Cannot answer the questions that actually move margin:
Which customers will churn in the next 30 days, before they churn? Which trial users convert before the trial ends? Which customers are genuinely persuaded by a discount versus which would have bought at full price? Which products face a demand spike requiring inventory and bid adjustment?
Each of those is a prediction problem requiring ML trained on historical behavioural patterns to generate probability estimates for future outcomes.
No ecommerce SaaS platform provides this with the model specificity that high-stakes decisions require.
LTV as historical average rather than individual prediction
Every platform calculates LTV using cohort-based historical averages — showing how customers acquired in a period have performed since. Useful for understanding cohort economics. Misleading as a proxy for individual value.
Cohort averages mask enormous individual variation. A cohort with a 12-month LTV of $185 may contain customers ranging from $20 to $2,000.
The average tells you nothing about which channels, creatives or segments produced the high-value end of that distribution — which is the only thing that changes your acquisition strategy.
BG/NBD probabilistic modelling predicts individual future purchase probability, and Gamma-Gamma modelling predicts individual monetary value.
Acquisition bidding, retention investment and discount eligibility are then calibrated to each customer’s predicted value rather than their cohort’s historical average.
Attribution without causal validation
Every platform applies some attribution model — last-click, first-click, linear, ML-weighted — to distribute conversion credit across touchpoints.
None answer the question that matters for budget allocation: which touchpoints genuinely caused the conversion, versus which were merely present in the journey and would not have changed the outcome if removed?
Budget allocated on correlational attribution funds channels capturing organic demand as though they generated it.
Validates contribution using controlled holdout experiments and synthetic control methodology, combined with Shapley value and Markov chain fractional attribution.
The output distinguishes demand generation from demand capture — which regularly reorders the channel ranking the dashboard produced.
No margin optimisation intelligence
Ecommerce profitability is a margin optimisation problem, not a revenue maximisation problem. The decisions that most affect margin need analytical capability these dashboards do not have.
Discount strategy applied uniformly. Retention investment spread evenly across at-risk customers. Acquisition bidding calibrated to conversion cost rather than predicted value.
Each of those decisions is made without the model that would make it correct — and each compounds monthly.
Discount uplift modelling identifies who genuinely needs an incentive versus who would have purchased anyway. Retention prioritisation combines individual churn probability with predicted LTV. Acquisition bidding is calibrated to probabilistic CLV.
These determine whether margin compounds or erodes, and none exist inside any dashboard.
Pixel-based signal degradation
Every platform in this category depends on pixel-based tracking at some layer — and every one is subject to the same structural degradation.
iOS privacy changes reducing event matching. Browser tracking prevention blocking fires. Cross-device journeys fragmenting profiles. Ad blockers suppressing pixels for a growing segment of high-value audiences.
Server-side tracking and probabilistic matching are workarounds for a structural problem, not solutions to it. The gap between pixel-reported data and true behaviour keeps widening.
Works from raw Shopify API extraction and first-party transactional data — order records, customer records, session data you own — rather than inferring behaviour from pixel fires.
The data does not degrade, because it was never dependent on a browser permitting a script to run.
Ecommerce analytics SaaS vs Cognitive Intelligence
The dashboards are not underbuilt. They are built to consolidate, and consolidation is a different job from prediction.
| Dimension | Ecommerce analytics SaaS | Cognitive Intelligence |
|---|---|---|
| Analytical level | ×Descriptive historical reporting | ✓Predictive and prescriptive modelling |
| LTV method | ×Cohort historical averages | ✓Individual BG/NBD and Gamma-Gamma |
| Attribution basis | ×Correlational credit distribution | ✓Causal lift validation |
| Attribution method | ×Fixed or ML-weighted rules | ✓Shapley value and Markov chain |
| Churn | ×Not predicted | ✓LSTM behavioural sequence modelling |
| Discount strategy | ×Uniform application | ✓Causal uplift modelling |
| RTO / returns | ×Aggregate rate monitoring | ✓XGBoost order-level propensity |
| Segmentation | ×Rule-based RFM thresholds | ✓DBSCAN behavioural clustering |
| Inventory and ads | ×Operating independently | ✓Inventory-constrained bid adjustment |
| Data source | ×Pixel-dependent signal | ✓Raw API and first-party data |
| Model maintenance | ×Static logic | ✓Monthly retraining, drift monitored |
| Final output | ×A dashboard | ✓An executed optimisation strategy |
| Commercial model | ×$200–$10,000+ subscription | ✓Custom engagement investment |
When ecommerce analytics SaaS is sufficient, and when it is not
Most DTC brands should keep their dashboard. The question is whether it should also be doing the predicting.
Ecommerce analytics SaaS is sufficient when
- Operational visibility is the requirement — consolidating Shopify, ad and email data into one view
- Decisions are primarily tactical: which campaigns to scale, which creatives to refresh, based on historical performance
- The operation is early-stage, where limited history means predictive models would be unreliable anyway
- The team lacks capability to work with model outputs, making dashboard simplicity a genuine requirement
- Klaviyo and Shopify native features already cover it — worth checking before adding a subscription
Cognitive Intelligence becomes necessary when
- Margin is eroding from discount automation applied to customers who would have paid full price
- Retention campaigns target lapsed customers with low reactivation probability, wasting send volume and deliverability
- Attribution data conflicts across platforms, suggesting independent causal measurement is required
- COD return rates are damaging unit economics and need order-level prediction before dispatch
- LTV varies widely across channels and segments, making LTV-based acquisition targeting materially valuable
- Inventory and advertising operate independently, wasting spend on products approaching stock-out
Where AI agents fit alongside your dashboard
Agents do not replace the dashboard — they populate it. Predicted LTV, churn risk and RTO scores written back into Triple Whale, Shopify or Klaviyo turn a descriptive view into a forward-looking one.
Workflow agents on n8n, Make.com or Zapier handle stock alerts, score sync and flash-sale monitoring. Autonomous agents produce the LTV, uplift and RTO scores no rule can. MCP gives either governed access to Shopify, BigQuery and the ad APIs; skills keep every run to the same standard.
| Task | Architecture that fits | Why |
|---|---|---|
| Predicting individual LTV | Autonomous — BG/NBD and Gamma-Gamma score every customer on fresh orders | A rule reports a cohort average, which is the limitation itself |
| Deciding who gets a discount | Autonomous — uplift modelling separates persuadable from decided | A rule gives everyone the same code, which is where margin leaks |
| Scoring RTO risk at checkout | Autonomous — order-level propensity from clickstream and checkout signals | A rule flags orders over a value threshold; it cannot rank risk |
| Pausing bids on low stock | Workflow with MCP — days-of-supply crosses threshold, bids drop, buyer alerted | Ideal for a rule; the threshold is an operational decision |
| Flash sale anomaly holds | Workflow — velocity spike triggers a data-quality hold and notification | Ideal for a rule, with autonomous cleaning behind it |
| Syncing scores into Klaviyo | Workflow with MCP — predicted LTV and churn written to segments | Ideal for a rule; the score comes from the model |
What stays with a person
- Discount policy itself. A model identifies who is persuadable; what the brand is willing to discount, and how often, is commercial judgement.
- Cancelling or holding a customer order. A high-RTO score routes for review — it never cancels on its own.
- Spend reallocation above the agreed threshold. A model recommends. A person signs it off.
- Product claims and brand copy. Generated at scale these become a compliance liability faster than a saving.
The full breakdown sits in the AI agents section.
Questions about ecommerce analytics tools
Do I need to cancel Triple Whale to work this way?
No, and most engagements keep it. It remains a good consolidation and reporting layer, and your team already knows it. What changes is what feeds it — predicted LTV, churn risk and uplift scores written back into the dashboard rather than cohort averages calculated inside it.
Why is cohort LTV not good enough?
Because a cohort average of $185 can contain customers worth $20 and customers worth $2,000, and every decision that matters — which channel to scale, who to retain, who gets a discount — depends on knowing which is which. The average is a useful business metric and a useless targeting signal.
Our Triple Whale and Meta numbers disagree. Which is right?
Usually neither, and the disagreement is the useful signal. Each platform attributes using its own methodology and its own incentives, which is why the sum of platform-claimed conversions routinely exceeds actual orders. The only way to settle it is a holdout or geo test measuring what happens when spend is removed — which no dashboard performs.
Is this relevant for a brand doing COD orders in Pakistan or the Gulf?
Particularly relevant. RTO in COD markets frequently runs 25–45%, and no dashboard in this category predicts it at order level — they report the aggregate rate after the fact. Order-level propensity scoring before dispatch turns that from an unavoidable cost into a manageable variable.
What data do you actually need to start?
Raw Shopify or WooCommerce order and customer exports, ad platform API access, and ideally BigQuery GA4 exports. Roughly two years of transaction history with meaningful repeat purchase makes the modelling reliable. Where that does not exist yet, that gets said directly rather than sold around.
Can AI agents replace the dashboard entirely?
They could, but it is rarely the right design. People need somewhere to look, and these dashboards are good at that. The productive pattern is agents producing the predictions and writing them into the tool your team already opens every morning.

Usman Saeed
AI-Driven Digital Marketing Intelligence Consultant & Growth Engineer in Pakistan. Usman Saeed specializes in engineering resilient digital growth architectures — helping enterprise brands eliminate tracking data drops, secure conversion signals, and maximize profitability through E-commerce Engineering, server-side Signal Engineering, and Predictive Intelligence. With 12+ years of experience and advanced data science expertise, marketing guesswork is replaced with mathematical precision — automated systems that bridge execution with business intelligence, ensuring your investment delivers measurable scale.
Where to go next
The ecommerce engagement starts with raw Shopify data, not your dashboard
The audit examines order-level data, attribution gaps and margin leakage. If your dashboard genuinely covers your decisions, you will be told that directly.