Maximize Meta Ads ROAS with AI-Driven Predictive Customer LTV Pricing Frameworks
Stop scaling ads based on temporary Day-1 ROAS. Our Meta Ads LTV prediction service feeds Meta’s Conversion API (CAPI) with real-time machine learning predictions that reveal exactly which customer profiles will spend 10x more over the next 365 days — so every rupee of ad spend chases long-term value, not short-term vanity metrics.
Most Shopify and e-commerce brands are still optimizing Meta campaigns around a single, immediate “Purchase” event. That approach made sense before iOS14. It doesn’t anymore. Today, the brands scaling profitably are the ones using predictive customer lifetime value for Facebook ads to tell Meta’s auction engine who their real customers are — not just who clicked first.
The Hidden Leak in Your Meta Ads Account: The iOS14 Performance Trap
Standard Meta pixels are looking at your customers through a keyhole. If your customer acquisition cost (CAC) is rising month over month, the root cause is usually simple: you are optimizing for a single, immediate checkout event, which forces Meta’s auction engine to chase low-ticket, one-time coupon hunters instead of long-term, high-margin buyers.
This is the core problem that AI-driven e-commerce LTV optimization is built to solve. Below are the three ways your current tracking protocol is quietly bleeding ad spend.
The Delayed Attribution Blindspot
A large share of high-value repurchases — particularly in cosmetics, wellness, apparel, and subscription-style retail — happen between day 30 and day 45 after the first purchase. Standard Meta Ads Manager attribution windows don’t wait that long. Your account marks those ad sets as “losers” and kills them before their real value ever shows up in the dashboard.
The Value-Based Lookalike Collapse
If you’re uploading generic customer lists to build lookalike audiences, Meta has no way to distinguish between an impulse buyer who spends Rs. 1,500 once and a premium buyer who spends Rs. 25,000 annually. Both look identical to the algorithm. This is exactly why Meta Value-Based Lookalikes (VBLAL) — audiences seeded with actual predicted dollar value, not just conversion events — consistently outperform standard 1% lookalikes built from raw purchaser lists.
Ad Budget Saturation
Scaling budgets without tracking predictive margins results in a skyrocketing Cost-Per-Acquisition (CPA), because you are effectively bidding blindly against your own internal customer segments — paying premium-buyer prices to acquire coupon-hunter customers.
If any of this sounds familiar, you don’t have a “Meta Ads problem.” You have a data problem that is showing up inside Meta Ads. This is the exact gap a predictive marketing intelligence agency is built to close.
Why “More Budget” Isn’t the Fix
The instinctive response to rising CAC is to increase budgets, refresh creative, or test new hooks. Those levers help at the margins, but they don’t touch the underlying issue: the auction is still being told to prioritize speed of conversion over quality of customer. Without a value-based lookalike audience automation layer feeding it better signal, Meta’s algorithm will keep doing exactly what it’s been doing — just faster, and at a higher cost per result. This is why brands that scale budget without first fixing their value signal often see CPA rise in lockstep with spend, rather than flattening out as the algorithm “learns.”
The Solution Core: How Our Predictive Engine Works
From Raw Shopify Infrastructure to a High-Converting Meta Machine
We built an e-commerce LTV data pipeline solution that takes your raw transactional data and turns it into a live, self-refreshing signal inside Meta Ads Manager. Here is exactly how it works, step by step.
1. Continuous E-Commerce Data Ingestion (Shopify API Integration)
Our Python-based architecture securely ingests your store’s historical transaction matrices — recency (R), frequency (F), and total monetary value (M) — along with product SKU affinities and cart behaviors. This is the same RFM foundation used in serious customer cohort analysis AI models, extended with your store’s specific purchase patterns.
2. Predictive Machine Learning Cohort Processing (Private Cloud Layer)
This is where customer lifetime value machine learning models do the heavy lifting. Using proven statistical frameworks — specifically BG/NBD and Gamma-Gamma models for Shopify data — our engine predicts future purchases, churn risk, and the exact dollar-value LTV of every single customer profile for the upcoming 90 to 365 days. Unlike blanket historical averages, these models account for purchase frequency, dropout probability, and monetary variance at the individual customer level.
3. One-Way Cryptographic Hashing (Data Privacy Guard)
Before any data leaves your ecosystem, consumer identifiers are locally hashed using one-way protocols — this is the same class of encryption behind SHA-256 hashing for Meta custom audiences. Raw database credentials and personally identifiable information never escape your infrastructure. Only irreversible mathematical hashes are transmitted.
4. Automated Meta Server-Side Streaming (Conversions API)
This answers the question we get asked constantly: how to feed LTV to Meta CAPI. The processed, dynamic-tier LTV data is piped directly into your Meta Ad Manager as an automated background stream via the Meta Conversions API predictive data stream, constantly refreshing your predictive custom audiences every 24 hours — so your lookalikes and exclusions are always working off current data, not a stale list from three months ago.
What Makes BG/NBD and Gamma-Gamma the Right Fit for E-Commerce
Not every LTV model is built for the same kind of business. Subscription companies often rely on cohort survival curves; SaaS companies lean on MRR expansion models. E-commerce is different — purchasing is irregular, discretionary, and driven by a mix of habit and opportunity. That’s precisely the pattern BG/NBD and Gamma-Gamma models for Shopify data are designed to handle:
- The BG/NBD (Beta Geometric/Negative Binomial Distribution) component models two separate probabilities for every customer: how often they’re likely to buy again while still “alive” as an active customer, and the probability they’ve already silently churned, even though they never explicitly cancelled anything — which matters enormously in non-subscription retail, where churn is invisible until it’s obvious.
- The Gamma-Gamma component then models the monetary side, predicting the expected average transaction value for each customer independent of purchase frequency, and combining the two outputs into a single dollar-value LTV per profile.
Together, these models replace guesswork with a defensible statistical forecast — this is what separates genuine customer lifetime value machine learning models from a spreadsheet that simply averages last year’s order values and calls it LTV. It’s also why our outputs remain reliable even for newer customers with only one or two transactions on record, since the model borrows statistical strength from similar cohorts rather than requiring years of individual purchase history.
If any point in this process breaks — a webhook drops, a token expires, a rate limit is hit — you don’t just lose a report, you lose the freshness of the audience Meta is actively bidding against. This is exactly the operational reliability gap that separates a monitored e-commerce LTV data pipeline solution from a plug-and-play SaaS integration.
Why This Outperforms Out-of-the-Box SaaS Tools
There’s a meaningful difference between a dashboard that shows you predicted LTV and a system that actually acts on it inside the ad auction. This is the most common source of Triple Whale LTV limitations and similar attribution tools: they report the number, but someone on your team still has to manually translate that number into campaign structure, audience uploads, and bid strategy — usually days after the insight is already stale.
| Protocol | Standard SaaS Subscriptions (Triple Whale, Klaviyo AI, Lifetimely) | Our Enterprise Predictive Marketing Service |
|---|---|---|
| Data Calculation Approach | Generic blanket historical averages that treat every niche identically | Custom feature-engineered models adjusted to your specific replenishment velocity |
| Media Buying Strategy | Static dashboard; execution left entirely to the client | Done-for-you execution — we build lookalikes, structure exclusions, and match bidding |
| Operational Reliability | Prone to third-party connection drops, attribution lag, and broken webhooks | Monitored, secure server-to-server pipelines with over 85% match rates |
| Business Output | Visual charts and static historical metrics | Direct incremental ROAS and scalable high-value acquisition |
If you’re currently relying on a dashboard-only tool and still doing the math manually to figure out your e-commerce CAC to LTV ratio, you already understand this gap firsthand. A ratio is only useful the moment it changes what your ad account does next — and that’s the part most SaaS platforms leave entirely up to you.
Proving It Works: Our Parallel Proof-of-Concept Framework
Proving the Incremental Revenue Lift (First 14 Days)
We don’t ask you to blindly trust our mathematical engine. We deploy a rigorous parallel testing framework so you can see, inside your own Ads Manager, exactly what changes and why:
- The Baseline Control Campaign: Your active Meta campaigns running your current broad or pixel-based purchase lookalike audiences.
- The Predictive Test Campaign: A parallel campaign running our custom Value-Based Lookalike (1% AI-engine VIP LTV audience).
- The Variable Controls: Identical ad creatives, identical copy assets, split budgets. Every point of positive variance in Average Order Value (AOV) or revenue is the direct, isolated result of targeting precision — not creative, not seasonality, not luck.
This side-by-side structure is also the clearest practical way to understand predictive LTV vs historical LTV: the baseline campaign is optimizing against what customers did buy; the test campaign is optimizing against what your best customers are predicted to buy over the next year.
Defeating Ad Creative Fatigue
Once our data profiles are validated, we inject customized ad copy angles tailored specifically to your VIP clusters. We isolate low-tier, clearance-focused shoppers from receiving premium bundle messaging (and vice versa) — which lowers ad fatigue frequency metrics and reduces long-term CPA across your entire account, not just the test campaigns.
Model Your Own Scaling Efficiency
Before committing budget, most operators want to see the math for their own store. Our interactive scaling simulator lets you input your current CAC, average order value, and repeat purchase rate to visualize how predictive segmentation changes your budget-to-revenue curve — and where an unoptimized account typically hits a spend ceiling and crashes efficiency.
Deep-Dive Frequently Asked Questions
Can my media buying team or agency copy this exact dataset and run away with it?
No. Data sent to Meta is processed through one-way cryptographic SHA-256 hashing for Meta custom audiences protocols and locked inside the Audience Manager ecosystem. Meta provides no mechanism to download, extract, or reverse-engineer these lists back into plain text. On top of that, predictive scores naturally decay in accuracy within days as real market behavior shifts — so even a stolen historic export would have little practical value to a competitor or a former employee.
How long does the machine learning engine take to reflect positive movement on our actual ad dashboard?
Data modeling and pipeline routing are typically completed within 5 business days. The machine learning feedback loop inside Meta’s auction then requires roughly 7 to 10 days of consistent training. Most enterprise brands see an organic lift in average basket size and overall campaign efficiency beginning in week two — this is a realistic answer to how to optimize Meta Ads for long term LTV rather than expecting overnight results.
Is this system fully compliant with modern international privacy protocols?
Yes. Our infrastructure runs on a serverless, first-party protocol. Because all customer data transformation happens inside your closed loop and is transferred only as mathematical hashes via a Meta Conversions API predictive data stream, the system bypasses browser-level ad blockers entirely while remaining fully compliant with GDPR and CCPA privacy standards.
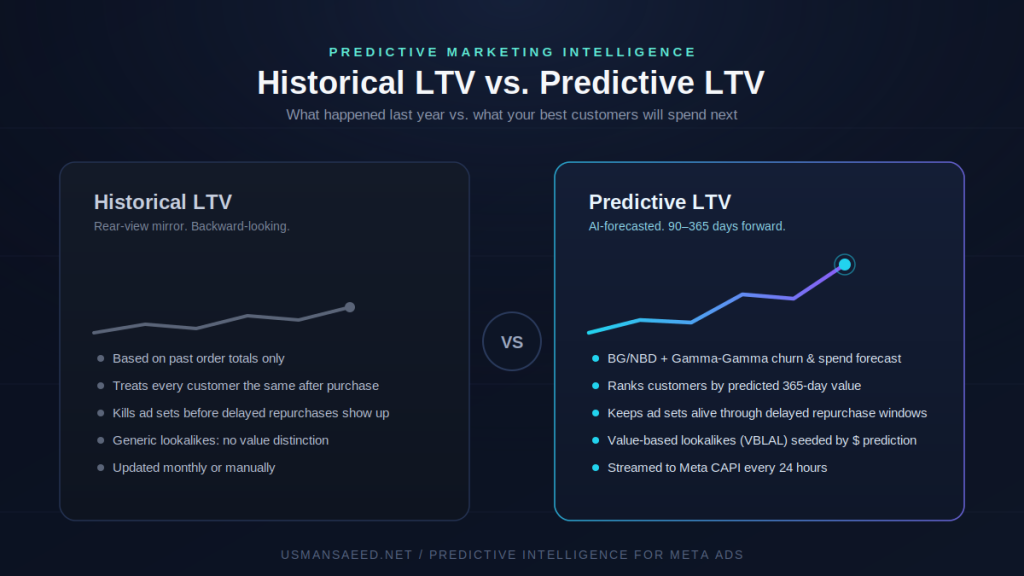
What’s the actual difference between predictive LTV and historical LTV?
Historical LTV tells you what a customer has already spent. Predictive LTV — built on BG/NBD and Gamma-Gamma models for Shopify transaction data — forecasts what that same customer, and customers who resemble them, are statistically likely to spend over the next 90 to 365 days, including their probability of churning before then. Historical LTV is a rear-view mirror; predictive LTV is what actually improves your e-commerce CAC to LTV ratio going forward, because it changes who you target before they’ve proven their value, not after.
Do I need a certain store size or order volume for this to work?
Predictive models need enough transaction history to build statistically reliable cohorts. As a general guide, stores with at least several thousand historical orders see the most stable BG/NBD and Gamma-Gamma outputs, though we assess this individually during the audit rather than applying a hard cutoff.
How is this different from just turning on Meta’s built-in Value Optimization bidding?
Meta’s native value-based bidding still relies on the value data your pixel or CAPI sends it. If that value data is just historical order totals, you’re feeding the auction backward-looking numbers. Our Meta Conversions API predictive data stream replaces that raw order value with a forward-looking predicted LTV score, refreshed every 24 hours — which is what actually changes who Meta’s algorithm decides to show your ads to.
Stop Bidding Blindly in the Meta Auction Engine
Do not let unoptimized pixels burn your cash reserves. Let us connect to your data layer for an absolute, no-obligation 30-Day LTV Discovery Audit to reveal your real customer valuation clusters — and see exactly where your e-commerce CAC to LTV ratio stands today versus where it should be.
Related Solutions
Looking to apply the same predictive LTV framework to Google Ads? Our AI-driven e-commerce LTV optimization methodology extends directly to Google Performance Max and Search through Enhanced Conversions and Offline Conversion Tracking (OCT), using Target ROAS (tROAS) bidding in place of Meta’s Value Optimization — built on the same underlying customer lifetime value machine learning models.
Who This Service Is Built For
This isn’t a general-purpose marketing tool. It’s engineered specifically for Shopify and e-commerce brands that already have meaningful order volume and are actively spending on Meta, but are hitting one of the following walls:
- Rising CAC despite stable or improving conversion rates — a strong signal that the auction is optimizing for the wrong customer profile, not that your funnel is broken.
- Flat or declining ROAS after scaling budget — often the first visible symptom of the ad budget saturation problem described earlier, where more spend simply buys more low-value conversions.
- Frustration with dashboard-only LTV tools — teams who already know their e-commerce CAC to LTV ratio in a spreadsheet but have no automated way to act on it inside the ad platform itself.
- Post-iOS14 attribution gaps — brands still relying on browser pixels alone, without a robust Meta Conversions API predictive data stream to recover lost signal.
- Agencies and in-house teams looking for a data layer, not a replacement — this service is designed to plug into your existing media buying process and strengthen the signal your team is already acting on, not to replace your strategic decision-making.
If your team already understands the difference between predictive LTV vs historical LTV conceptually but lacks the engineering resources to build a BG/NBD and Gamma-Gamma pipeline, hash and stream it through CAPI, and maintain it reliably at scale — that gap is exactly what our e-commerce LTV data pipeline solutions are built to close.
The Business Case: Why Predictive LTV Changes Unit Economics
At its core, this service exists to fix one number: your blended e-commerce CAC to LTV ratio. Most brands track this metric monthly in a spreadsheet, using historical, backward-looking LTV. The problem is that decisions about ad spend, audience targeting, and bid strategy happen daily inside Meta’s auction — long before that monthly number ever gets recalculated.
By replacing historical LTV with a continuously refreshed predictive score, three things change simultaneously:
- Your CAC ceiling moves. Once you can reliably identify which customer segments are worth 5x or 10x more over a year, you can justify a higher acquisition cost for those specific segments — while keeping your blended CAC in check by suppressing spend on low-value lookalikes.
- Your budget scaling curve flattens later. Standard accounts hit an efficiency wall as they scale, because incremental spend increasingly buys marginal, low-intent traffic. A value-based audience delays that wall by continuously feeding the auction better examples of who to find more of.
- Your creative testing gets sharper. Because VIP and low-tier segments are isolated rather than blended, creative performance data stops being diluted by audiences that were never going to convert into high-value customers in the first place.
None of this requires replacing your existing tech stack, your agency, or your in-house media buyer. It requires a reliable predictive marketing intelligence agency feeding better data into the system you already run.